Over the past few months, I have switched most of my development workflows to GitHub Copilot CLI. Whether I'm exploring a codebase, writing code, debugging, or even building a new application, I find myself in GitHub Copilot CLI most of the time. It's fast, it keeps me in the flow, and the agentic capabilities make it incredibly productive.
Many users have asked me how to track context usage in the CLI ?
First of all, you can always use the /context and /usage commands to get a snapshot of your current context window usage.
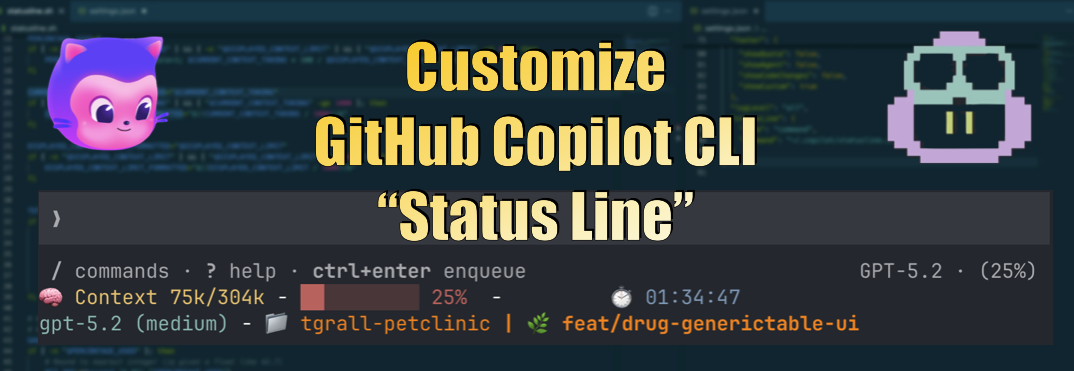
Nevertheless, you can also have a live status line that shows your token consumption and context usage percentage in real time, without needing to type any command, you just need to use the experimental statusLine.command feature to run a custom script to generate the status line content.
As of 1st of May 2026, statusLine.command is an experimental feature and is subject to change. The payload format, configuration keys, and behavior described here may evolve in future releases. I'll do my best to keep this post updated, but always check the official docs for the latest.
This post walks you through setting it up from scratch. I also document the full JSON payload that Copilot sends to your script — I captured it directly from a live session to build the reference table below.
I’ve also published two demonstrations on my YouTube channel:
- 🇬🇧 Customize GitHub Copilot CLI "Status Line" : Boost your terminal sessions!
- 🇫🇷 Personnaliser la "Status Line" de GitHub Copilot CLI : Boostez votre terminal !
Prerequisites
| Tool | Why |
|---|---|
| GitHub Copilot CLI | The host that calls your script |
jq | Parses the JSON payload piped to stdin (stedolan.github.io/jq) |
A POSIX-compatible shell (bash, zsh, dash, …) | Runs the script |
Windows users — see the Windows section at the end. (I am not a Windows user, so I welcome contributions to that section!)
1 — Enable the Experimental Feature
statusLine is behind an experimental gate. Pick one of the following approaches, then restart Copilot CLI:
# Option A: turn on all experimental features
copilot --experimental
# (or type /experimental on inside a running session)

# Option B: enable only STATUS_LINE in config
# Edit ~/.copilot/settings.json and add:
#   "feature_flags": { "enabled": ["STATUS_LINE"] }
After restarting, the CLI will look for statusLine in your config.
If you toggle experimental mode, restart Copilot CLI before testing. The feature flags are read at startup, simply call the /restart command.
2 — Create the Script
Save the following as ~/.copilot/statusline.sh (or any path you like):
#!/usr/bin/env bash

set -eu

payload=$(cat)

current_context_tokens=$(echo "$payload"  | jq -r '.context_window.current_context_tokens  // empty')
displayed_context_limit=$(echo "$payload"  | jq -r '.context_window.displayed_context_limit  // empty')
used_percentage=$(echo "$payload"  | jq -r '.context_window.used_percentage  // empty')

total_duration_ms=$(echo "$payload" | jq -r '.cost.total_duration_ms // 0')


current_context_tokens_formatted="$current_context_tokens"
if [ -n "$current_context_tokens" ] && [ "$current_context_tokens" -ge 1000 ]; then
    current_context_tokens_formatted="$(printf '%.1fk' "$(echo "scale=1; $current_context_tokens / 1000" | bc)")"
fi

displayed_context_limit_formatted="$displayed_context_limit"
if [ -n "$displayed_context_limit" ] && [ "$displayed_context_limit" -ge 1000 ]; then
    displayed_context_limit_formatted="$((displayed_context_limit / 1000))k"
fi


# ── Format total duration as HH:MM:SS if available ──────────────────────────────
total_duration="00:00:00"
if [ "$total_duration_ms" -gt 0 ]; then
    # Convert ms to seconds, then format as HH:MM:SS locally no functions for this in bash
    total_seconds=$((total_duration_ms / 1000))
    hours=$((total_seconds / 3600))
    minutes=$(((total_seconds % 3600) / 60))
    seconds=$((total_seconds % 60))
    total_duration=$(printf "%02d:%02d:%02d" "$hours" "$minutes" "$seconds")
fi

# ── Build the gauge ──────────────────────────────────────────────
# 10-cell bar: each cell = 10 %. Filled = █, empty = ░
gauge=""
if [ -n "$used_percentage" ]; then
    # Round to nearest integer (jq gives a float like 42.7)
    pct_int=$(printf '%.0f' "$used_percentage")

    filled=$(( pct_int / 10 ))
    empty=$(( 10 - filled ))

    i=0; while [ $i -lt $filled ]; do gauge="${gauge}█"; i=$((i+1)); done
    i=0; while [ $i -lt $empty  ]; do gauge="${gauge}░"; i=$((i+1)); done

    gauge="${gauge} ${pct_int}%"
fi


# ── Format the final status line content ──────────────────────────────
printf "🧠 Context %s/%s - %s - " "$current_context_tokens" "$displayed_context_limit_formatted" "$gauge"
printf "\t⏱️ %s" "$total_duration"
Make it executable:
chmod +x ~/.copilot/statusline.sh
Use Any Language
The statusLine.command is not limited to Bash — you can use any language that supports a shebang (#!). As long as your script reads JSON from stdin and prints the status line to stdout, it will work.
Here are equivalent examples in Shell (sh), Python, and JavaScript (Node.js):
- Shell (sh)
- Python
- JavaScript (Node.js)
#!/usr/bin/env bash

input=$(cat)
model=$(echo "$input" | jq -r '.model.display_name')
displayed_context_limit=$(echo "$input" | jq -r '.context_window.displayed_context_limit')
printf "%s - Context Limit %s (sh)" "$model" "$displayed_context_limit"
#!/usr/bin/env python3

import sys
import json

input_data = sys.stdin.read()
data = json.loads(input_data)
model = data['model']['display_name']
displayed_context_limit = data['context_window']['displayed_context_limit']
print(f"{model} - Context Limit {displayed_context_limit} (Python)")
#!/usr/bin/env node

let input = '';
process.stdin.on('data', chunk => input += chunk);
process.stdin.on('end', () => {
    const data = JSON.parse(input);
    const model = data.model.display_name;
    const displayedContextLimit = data.context_window.displayed_context_limit;
    console.log(`${model} - Context Limit ${displayedContextLimit} (JS)`);
});
Don't forget to make your script executable (chmod +x) and ensure the interpreter is available on your PATH. For Python and Node.js, you don't need jq — the JSON parsing is handled natively.
3 — Wire It Up in Config
Open ~/.copilot/settings.json and add the statusLine key:
{
  "statusLine": {
    "type": "command",
    "command": "~/.copilot/statusline.sh",
    "padding": 1
  }
}
Tip: The
commandvalue supports~expansion and environment variables, so$HOME/.copilot/statusline.shworks too.
If you useCOPILOT_HOMEor--config-dir, your config lives in that directory instead of~/.copilot/.
Restart Copilot CLI. After the first model call you should see something like:
🧠 Context 0/168k - █░░░░░░░░░ 19% - ⏱️ 00:17:34
Statusline Command JSON Payload
All fields returned by the statusline.command API payload.
Full JSON Payload Reference
Top-Level Fields
| Field | Type | Nullable | Description |
|---|---|---|---|
cwd | string | No | Current working directory of the CLI process |
session_id | string | Yes | Unique identifier for the current session |
session_name | string | Yes | Human-readable session title (e.g. "Configure Copilot Integration") |
transcript_path | string | Yes | File system path to the session state directory |
version | string | No | CLI version (e.g. "1.0.40") |
model
Information about the currently selected model.
| Field | Type | Nullable | Description |
|---|---|---|---|
model.id | string | Yes | Model identifier (e.g. "gpt-5.4", "claude-sonnet-4.5") |
model.display_name | string | Yes | Human-readable model name (e.g. "gpt-5.4 (medium)") |
workspace
| Field | Type | Nullable | Description |
|---|---|---|---|
workspace.current_dir | string | No | Current working directory (same value as top-level cwd) |
cost
Session-level cost and activity metrics (cumulative for the entire session).
| Field | Type | Nullable | Description |
|---|---|---|---|
cost.total_api_duration_ms | number | No | Total time spent in API calls (milliseconds) |
cost.total_lines_added | number | No | Total lines added by edits in this session |
cost.total_lines_removed | number | No | Total lines removed by edits in this session |
cost.total_duration_ms | number | No | Wall-clock time since session start (milliseconds) |
cost.total_premium_requests | number | No | Number of premium model requests made |
context_window
Token usage and context window metrics. This section contains two different perspectives — see the notes below the table.
Cumulative Token Counts (across all API calls in the session)
| Field | Type | Nullable | Description | Used by |
|---|---|---|---|---|
context_window.total_input_tokens | number | No | Sum of input tokens from every API call | /usage ↑ |
context_window.total_output_tokens | number | No | Sum of output tokens from every API call | /usage ↓ |
context_window.total_cache_read_tokens | number | No | Total tokens served from prompt cache | /usage cached |
context_window.total_cache_write_tokens | number | No | Total tokens written to prompt cache | — |
context_window.total_reasoning_tokens | number | No | Total tokens used for chain-of-thought reasoning | /usage reasoning |
context_window.total_tokens | number | No | total_input_tokens + total_output_tokens | — |
Raw Model View (based on last API call vs full model window)
These fields use the full model context window (max_context_window_tokens) as their reference. They reflect the most recent API call only, not accumulated usage.
| Field | Type | Nullable | Description | Formula |
|---|---|---|---|---|
context_window.context_window_size | number | Yes | Raw maximum context window from model capabilities | model.capabilities.limits.max_context_window_tokens |
context_window.last_call_input_tokens | number | No | Input tokens from the most recent main-agent API call | — |
context_window.last_call_output_tokens | number | No | Output tokens from the most recent main-agent API call | — |
context_window.used_percentage | number | Yes | Percentage of full context window used by last call | (last_call_input + last_call_output) / context_window_size × 100 |
context_window.remaining_percentage | number | Yes | Percentage of full context window remaining after last call | 100 - used_percentage |
context_window.remaining_tokens | number | Yes | Tokens remaining after last call | context_window_size - (last_call_input + last_call_output) |
Display View (matches /context command and model badge)
These fields use the displayed context limit — a smaller, more practical number that accounts for output token reservations. Use these fields to match the /context UI.
| Field | Type | Nullable | Description | Formula |
|---|---|---|---|---|
context_window.current_context_tokens | number | Yes | Locally-counted accumulated prompt tokens (system + tools + messages). Updated live via session events. | Computed by calculateTokenBreakdown() |
context_window.displayed_context_limit | number | Yes | Practical context limit shown in UI. Smaller than context_window_size because it reserves space for output. | promptTokenLimit + min(32k, outputTokenLimit) (64k for 1M models) |
context_window.current_context_used_percentage | number | Yes | Percentage of displayed limit used. Matches the model badge. | current_context_tokens / displayed_context_limit × 100 |
Current Model Usage (per-model breakdown)
| Field | Type | Nullable | Description |
|---|---|---|---|
context_window.current_usage | object | Yes | Token usage breakdown for the currently selected model only |
context_window.current_usage.input_tokens | number | No* | Input tokens for current model |
context_window.current_usage.output_tokens | number | No* | Output tokens for current model |
context_window.current_usage.cache_creation_input_tokens | number | No* | Cache write tokens for current model |
context_window.current_usage.cache_read_input_tokens | number | No* | Cache read tokens for current model |
remote
Information about remote/cloud session state (e.g. Copilot Cloud Agent tasks).
| Field | Type | Nullable | Description |
|---|---|---|---|
remote.connected | boolean | No | Whether a remote session is active |
remote.indicator | string | Yes | Display indicator character (e.g. "☁") — only present when connected |
remote.task_id | string | Yes | Remote task identifier |
remote.task_name | string | Yes | Remote task display name |
remote.task_url | string | Yes | URL to the remote task |
remote.task_type | string | Yes | Type of remote task |
remote.repository | object | Yes | Repository info for the remote session (see sub-fields below) |
remote.repository.owner | string | No* | Repository owner (e.g. "github") |
remote.repository.name | string | No* | Repository name (e.g. "copilot-agent-runtime") |
remote.repository.branch | string | No* | Branch name |
remote.pull_request_number | number | Yes | Associated PR number, if any |
remote.context | object | Yes | Working directory context from the remote environment (see sub-fields below) |
remote.context.cwd | string | No* | Remote current working directory |
remote.context.gitRoot | string | Yes | Remote git repository root |
remote.context.repository | string | Yes | Repository identifier (e.g. "owner/repo") |
remote.context.hostType | string | Yes | Hosting platform type (e.g. "github", "ado") |
remote.context.repositoryHost | string | Yes | Raw host string (e.g. "github.com") |
remote.context.branch | string | Yes | Current git branch |
remote.context.headCommit | string | Yes | Current HEAD commit SHA |
remote.context.baseCommit | string | Yes | Merge-base commit SHA (fork point from remote default branch) |
Notes
Why context_window_size ≠ displayed_context_limit
context_window_sizeis the raw model maximum (e.g. 400,000 for gpt-5.4).displayed_context_limitis the practical limit shown to users =promptTokenLimit + min(32k, outputTokenLimit). It's smaller because part of the window is reserved for output tokens.
Why used_percentage ≠ current_context_used_percentage
They differ in both numerator and denominator:
| Metric | Numerator | Denominator |
|---|---|---|
used_percentage | last_call_input + last_call_output (single API call) | context_window_size (full model limit) |
current_context_used_percentage | current_context_tokens (accumulated, locally counted) | displayed_context_limit (practical limit) |
Recommendation: Use current_context_used_percentage and displayed_context_limit for UI parity with the CLI.
Windows: Git Bash & PowerShell
Option A — Git Bash
If you have Git for Windows installed, you already have Bash and can install jq via scoop or by dropping the jq.exe binary on your PATH.
Set the command in config to point at the Git Bash executable:
{
  "statusLine": {
    "type": "command",
    "command": "bash C:/Users/you/.copilot/statusline.sh"
  }
}
Use forward slashes or escaped backslashes in the path.
~expansion may not work on Windows; use the absolute path instead.
Option B — PowerShell (no jq needed)
If you prefer a native Windows approach, save a .ps1 script:
# statusline.ps1
$json = $input | Out-String | ConvertFrom-Json
$t = $json.context_window.total_tokens
$p = [math]::Round($json.context_window.used_percentage)
$filled = [int]($p / 10)
$bar = ('█' * $filled) + ('░' * (10 - $filled))
Write-Host -NoNewline "tokens: $t  $bar ${p}%"
Config:
{
  "statusLine": {
    "type": "command",
    "command": "powershell -NoProfile -File C:\\Users\\you\\.copilot\\statusline.ps1"
  }
}
Caveat: PowerShell startup adds latency. If the 10-second timeout is tight on your machine, prefer the Git Bash route.
Recap
- Enable the experimental
STATUS_LINEfeature and restart. - Create
~/.copilot/statusline.shwith the gauge script. - Configure
statusLine.commandin~/.copilot/settings.json.
And remember: you can always type /context and /usage inside a Copilot CLI session to get a one-off snapshot of your context window usage. The status line just makes it always visible without interrupting your flow.
Happy coding!